
Stories don't compound. ROIIC does.
The quest to fix my portfolio led me to quality. Boy was I led astray by catchy stories.

Before we start, a note to my Russian readers. You have been added to this mailing list, because the old one is not active anymore. I am done with writing in Russian for a time being. Mostly because there is no feedback and I maintain that discussion is critical for retail investors. Because it is so easy to fall into confirmation bias bubble. So I am actively trying to get out.
If you choose to stay with me and bear my clunky English pieces I will be forever grateful. If not, I cannot blame you. Writing this is as hard as reading. But I am trying to improve. And improve I will.
The value investing cosplay circa 2026
The Graham/Buffett game in 2026 is mostly cosplay. People say “good business at a fair price” and what they actually mean is “find something cheap with a story I can write about.” The story does the work. Fundamentals show up later as decoration.
The trouble is stories are easy.
Every dropping stock has one.
Every undervalued narrative has a following of believers explaining why this one is different.
What rarely shows up is the part where someone explains, in mechanical terms, what makes a business actually good. Not “wide moat.” Not “great management.” Real numbers about real things.

I’ve been working through this question for the last few months and ROIIC is the cleanest answer I’ve found so far. Not the only answer. But the one that most directly tells you whether the next dollar this business reinvests is going to be a good investment, or just a dollar. That distinction is the whole game.
This post walks through two ways to compute it. Huber’s version and Mauboussin’s version. One is quick. One is precise. I’ll show the formulas, where the inputs live on the 10-K, and run them both through Walmart 2006-2016 to see what the numbers actually say.
This is not an original idea and I am following the footsteps of Huber and Mauboussin. But that’s the way I learn and I hope you will learn too.
Why headline ROIC lies
Return on Invested Capital (ROIC) looks simple. Earnings divided by the capital the business uses to earn them.
ROIC = Earnings / Invested CapitalA business earning 20% on capital is producing more per dollar deployed than a business earning 5%. Headline ROIC is that number for the whole company at a point in time.
The problem is that ROIC does not give the “business quality today” picture.
Capital deployed in 2010 at 25% returns sits next to capital deployed in 2024 at 8% returns and you get a respectable-looking 17% blended number. The blended number lies. As an investor buying the business today, you don’t get the historical 25%, or even 17%. You get the future returns of the capital deployed. Whatever the business does with its NEXT dollar.
Picture two buckets. First is an old capital the company deployed a decade ago when it was a different business in a different market. Second is new capital deployed over the last few years at current economics. Headline ROIC stirs both buckets together. The investor buying today is lucky to only fund on second bucket terms. If situation is improving - that’s a good thing. But I rarely see companies that are improving today with tariffs, wars and other stuff going on.
Return on Incremental Invested Capital (ROIIC) is different to ROIC in that it measures the second bucket. The marginal return on capital actually being deployed recently.
ROIIC = ΔEarnings / ΔInvested CapitalThe delta is the key. We look only at incremental.
ROIIC = (Earnings_year_N − Earnings_year_0) / (InvestedCapital_year_N − InvestedCapital_year_0)Two endpoints, one subtraction each, one division. The formula is simple. The hard part is picking the right inputs, and that is where we introduce two investing experts: Huber and Mauboussin. Both are household names.
And before we go into details - one teaser. Pair ROIIC with a reinvestment rate and you get the punchline formula for how intrinsic value of a company compounds:
Intrinsic Value Growth ≈ ROIIC × Reinvestment RateA business with 25% ROIIC and 80% reinvestment compounds IV at 20% per year. A business with 10% ROIIC and 25% reinvestment compounds at 2.5%. Same math. Wildly different investor outcomes over ten years.
Most of value investing debate is about the price. This formula is about the business. The price determines your entry; this formula determines whether the business is worth entering at all. And that’s exactly what we are looking for to determine if the business is actually any good.
Method 1: Huber
John Huber at Saber Capital wrote the cleanest practical guide to computing ROIIC I’ve come across. His Return on Capital series is the curriculum I wish someone had handed me when I started taking this stock-picking thing seriously. The piece that compiles the math is Calculating the Return on Incremental Capital Investments. Read it. My summary is shorter; his original is better.
Huber’s recipe is mechanically simple. Two numbers at year 0, the same two at year N.
Earnings:
Earnings = Net IncomeNet income off the income statement. The number the equity holder actually pockets after everything.
Tangible Invested Capital:
Tangible IC = Total Debt + Total Equity − Goodwill − Excess CashWhy each piece:
Total Debt because interest-bearing capital is real capital the business has to earn a return on.
Total Equity because book equity is the cumulative retained earnings and paid-in capital the business is operating with.
Minus Goodwill because acquired goodwill is price paid above book value, not productive capital.
Minus Excess Cash because cash sitting idle inflates the denominator and depresses ROIC. A rough heuristic: anything above 2% of revenue for a mature business, 5% for a growth business.
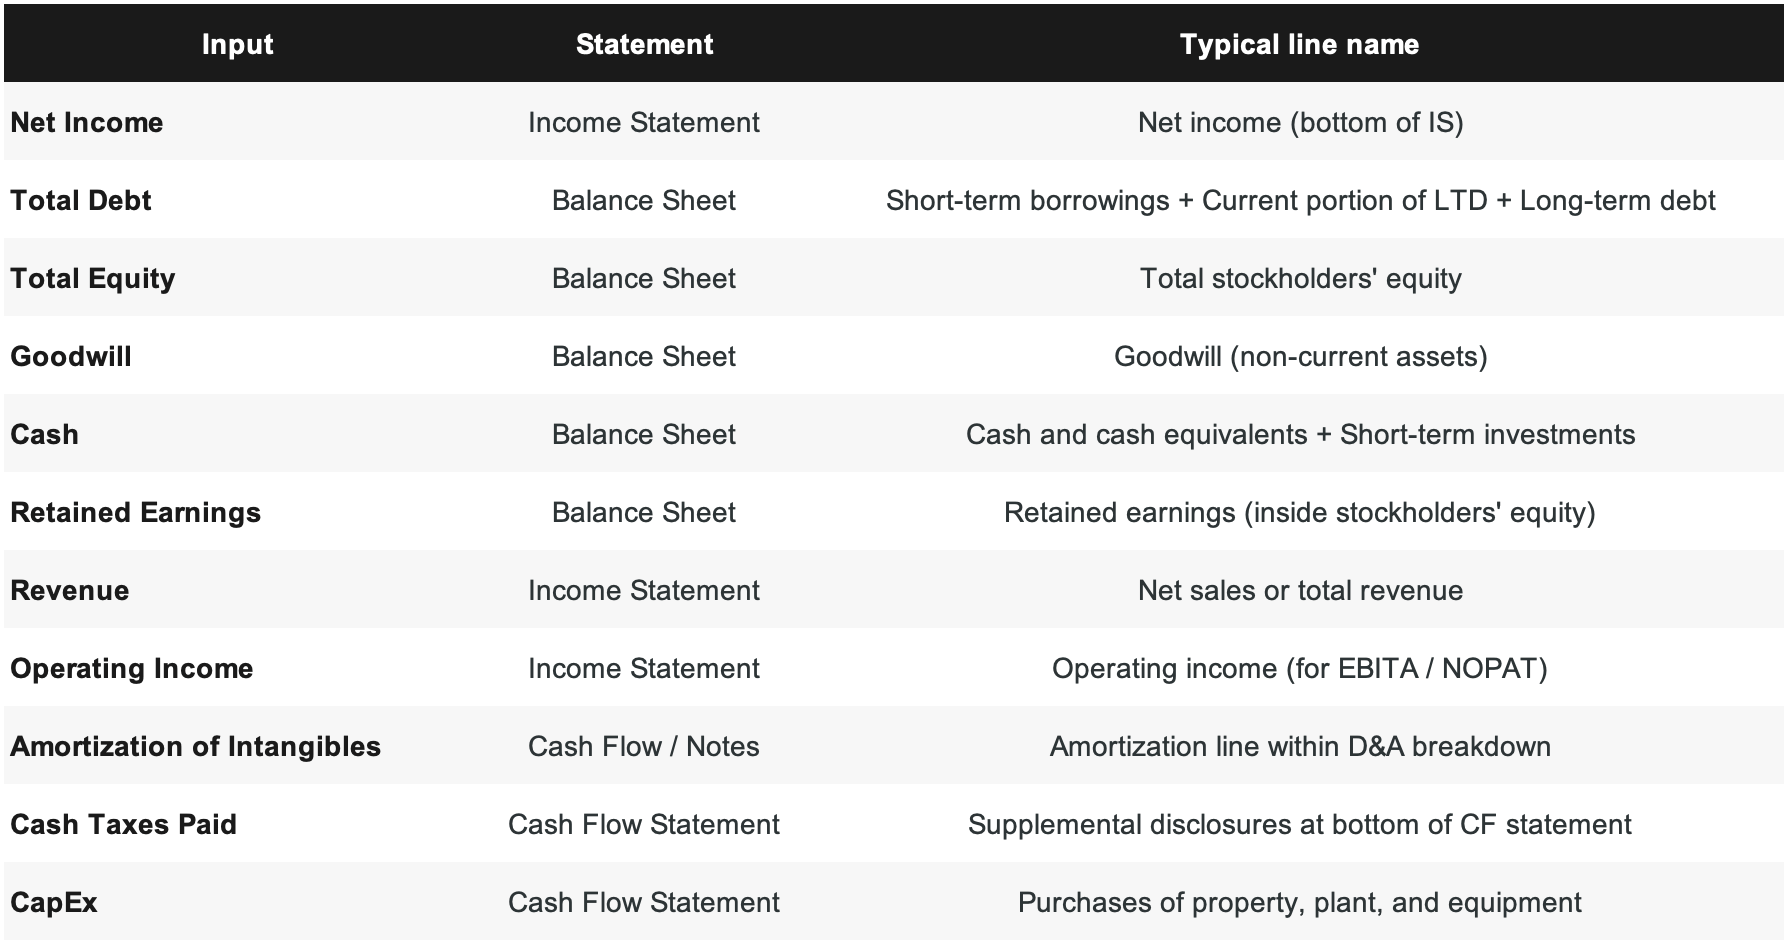
Here’s the statement-to-line-item cheat sheet:
Pair ROIIC with a reinvestment rate, computed two ways:
Method A:
Reinvestment Rate_A = ΔInvested Capital / Σ Earnings (over the period)Of every dollar the business earned across the window, how many got plowed back into the capital base?
Method B:
Reinvestment Rate_B = (RetainedEarnings_year_N − RetainedEarnings_year_0) / Σ EarningsOf every dollar earned, how many stayed inside the company versus walking out as dividends?
The two should match. When they don’t, the gap is telling you something.
Method A > Method B by a lot
Debt or equity issuance funded the gap. Capital came from outside, not from retention. Ask: is the debt service sustainable? Was the equity issuance dilutive?
Method A < Method B by a lot
Retained earnings were returned via buybacks or used for debt paydown rather than deployed into new productive capital. Ask: were the buybacks below intrinsic value, or buyback-to-nowhere?
Method A ≈ Method B
Clean reinvestment via retention. Default healthy case.
The final idea stays the same either way:
IV Growth ≈ ROIIC × Reinvestment RateHuber uses net income because it’s simple and it’s what the shareholder actually takes home. He admits in the piece that NOPAT or owners’ earnings are more precise. Enter Mauboussin.
Method 2: Mauboussin
Michael Mauboussin and Dan Callahan published Calculating Return on Invested Capital at Credit Suisse in 2014. It is the modern industry standard, 23 pages, dense, and worth every minute. If Huber wrote the practitioner’s recipe, Mauboussin wrote the reference manual.
The core difference is the earnings input. Where Huber uses net income, Mauboussin uses NOPAT. Three changes come with that swap.
Change 1: EBITA, not EBIT.
EBITA = Operating Income + Amortization of IntangiblesDepreciation stays as an expense. It represents real physical wear on real physical assets. Amortization of acquired intangibles is just an accounting echo of past M&A and gets added back. The goal is to capture the true operating cash earning power of the business, undistorted by prior acquisitions.
Change 2: Cash taxes, not the statutory rate.
Cash Taxes = Tax Provision + ΔDeferred Tax Liability − (Interest × Tax Rate)Three pieces. The tax provision from the income statement, adjusted for any unusual items. The change in deferred tax liability captures the gap between book and cash taxes. A growing deferred tax liability reduces the current cash burden. The third piece is the tax shield on interest, which has to be removed to put levered and unlevered companies on equal footing. Otherwise a company with lots of debt looks artificially more profitable just because its interest expense reduced its tax bill.
Putting it together:
NOPAT = EBITA − Cash TaxesOr the modeling shortcut Mauboussin gives for projections:
NOPAT = EBITA × (1 − Cash Tax Rate)The cash tax rate is typically a touch below the statutory rate for growing companies.
Change 3: Invested capital from both sides of the balance sheet.
Mauboussin recommends computing invested capital two ways and reconciling.
Assets side:
Invested Capital = Net Working Capital
                 + Net PP&E
                 + Goodwill
                 + Other Operating Assets
Where net working capital is current assets minus non-interest-bearing current liabilities. Accounts payable counts as non-interest-bearing. Short-term debt does not.
Liabilities + Equity side:
Invested Capital = Short-term Debt + Long-term Debt
                 + Deferred Tax Liabilities
                 + Other Long-term Liabilities
                 + Preferred Stock
                 + Shareholders' Equity
The two sides should agree. When they don’t, that is the information. Usually it is a minority interest line, a weird long-term liability, or an inconsistent excess-cash adjustment that didn’t get propagated to both sides. Hunt it down and fix it.
Mauboussin’s universal decision rule for anything borderline:
“If you are wondering whether to include an item in invested capital, simply ask if the company could generate the same level of NOPAT without the item. If not, include it. If so, exclude it.”
That single sentence resolves 80% of the edge cases.
The Mauboussin ROIIC formula itself is the same shape as Huber’s, sharper notation:
ROIIC = (NOPAT_year_N − NOPAT_year_0) / (InvestedCapital_year_N − InvestedCapital_year_0)The two methods side by side
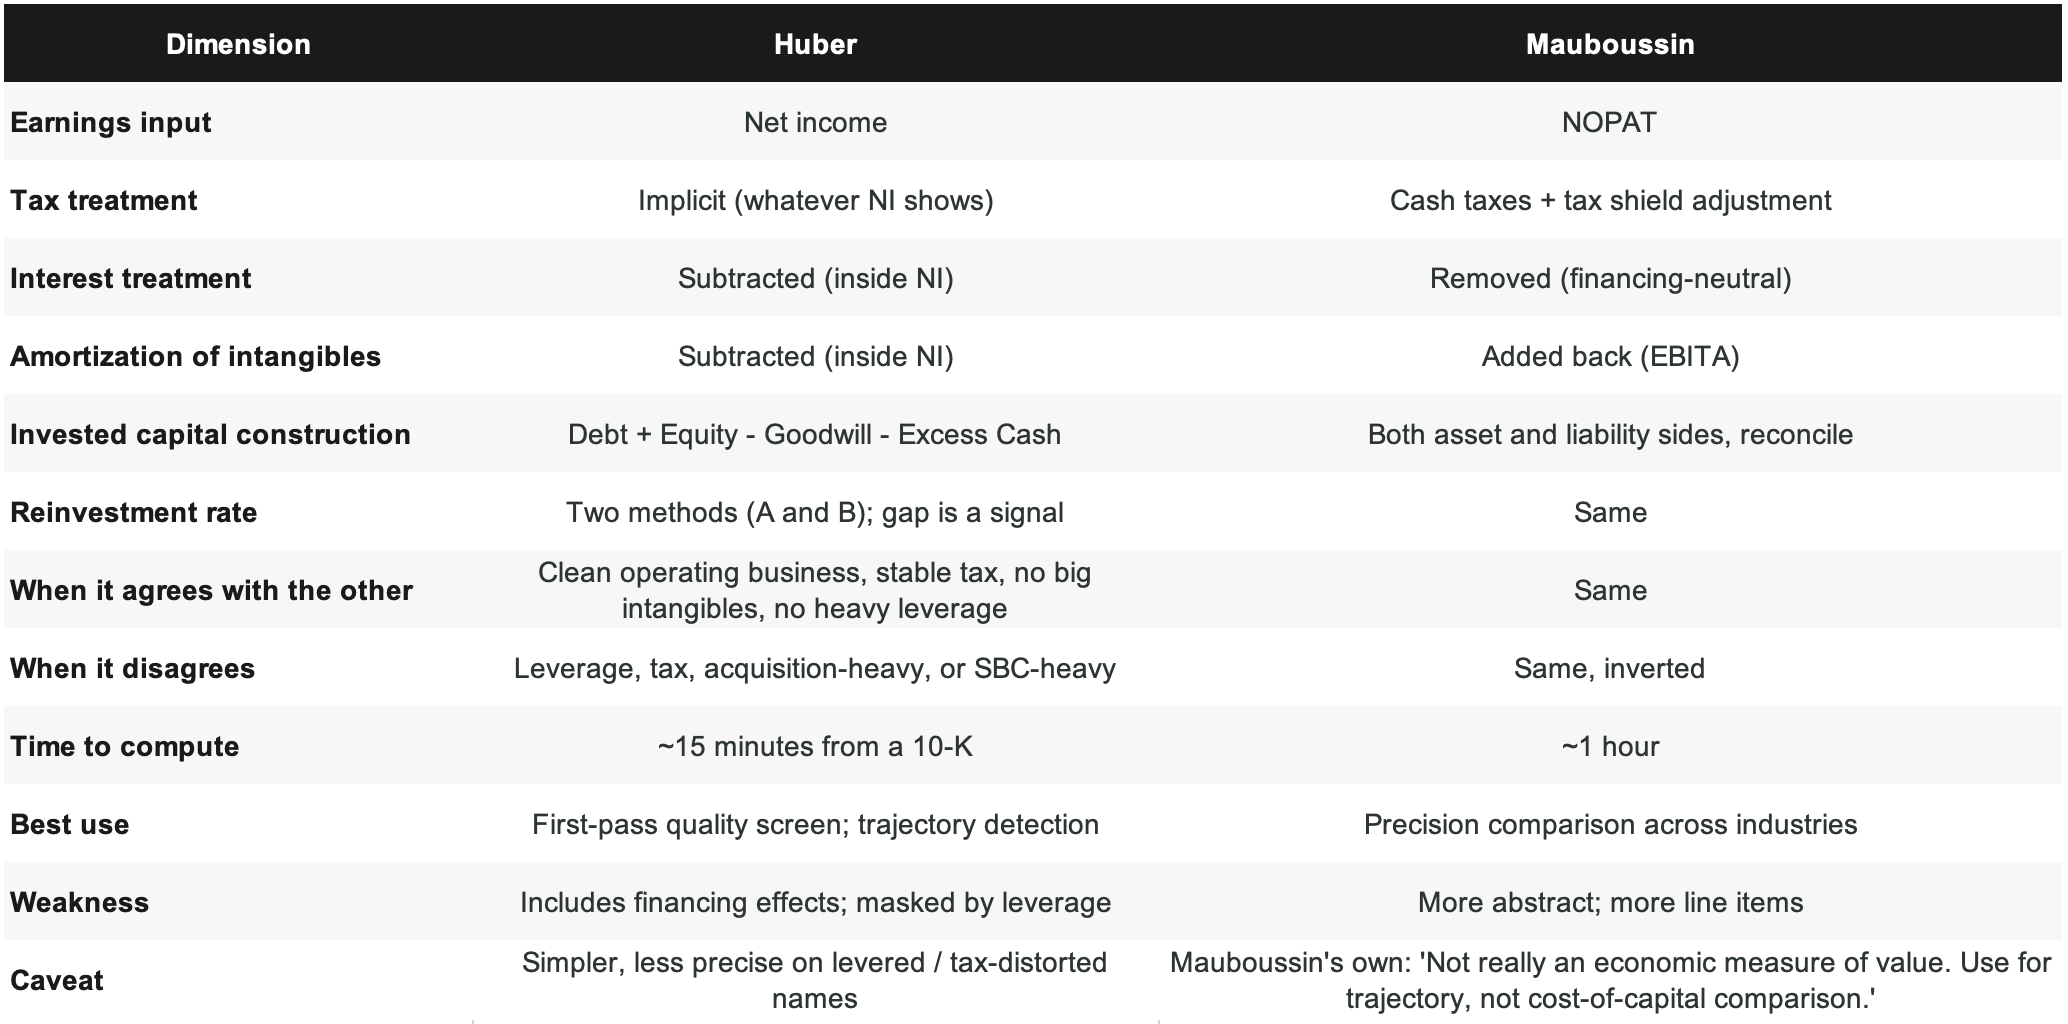
The two frameworks are not alternatives. They are complementary. I default to Huber for the first pass because net income is what shows up 10Ks. Mauboussin sits next to it as a divergence check. When the two answers agree, the Huber number is reliable. When they disagree by more than five percentage points, something is going on with leverage or taxes or intangibles and it is worth figuring out what.
Both are cleaner if you run them on 5-year and 10-year rolling windows rather than a single snapshot. The 5-year catches cyclicality. The 10-year smooths through a full business cycle. Reading them together tells you whether a dip is cyclical or structural. Mauboussin actually walks through a Cisco example where the 1-year ROIIC was +304% in 2012, −778% in 2013, and the 3-year rolling came out at 47%. The 1-year numbers are noise. The window matters.
Worked example: Walmart 2006-2016
This is Huber’s canonical example. The data is public, the conclusions are non-obvious, and the contrast with what headline ROIC says is exactly the teaching moment ROIIC was built for.
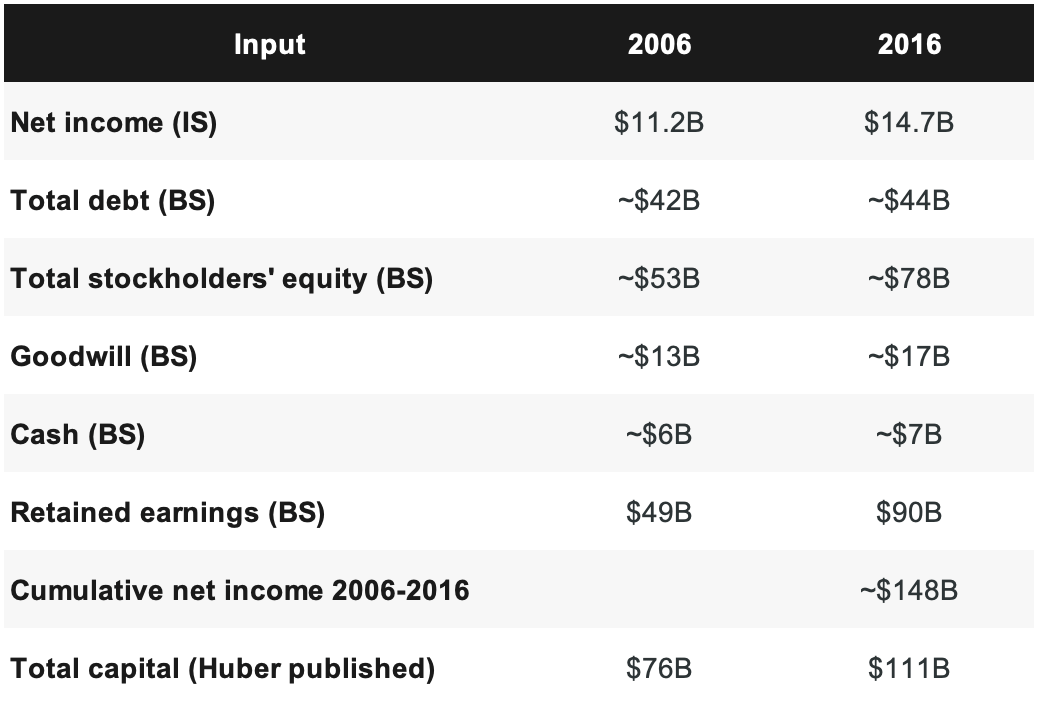
I’m rounding. The real numbers are in Walmart’s 10-K filings on SEC EDGAR.
Step 2: Compute Tangible Invested Capital (Huber)
Tangible IC_2006 = $42B + $53B − $13B − $6B = $76B
Tangible IC_2016 = $44B + $78B − $17B − $7B = $98B
Huber’s numbers in his worked example are $76B and $111B. Mine for 2016 came out at $98B. The difference is Huber appears to include Walmart’s accumulated other comprehensive income, minority interest, and a slightly different cash adjustment in his total capital number.
I’m going to use Huber’s numbers because that is what his published analysis uses, but you can see right here the “this calculation takes 15 minutes” is actually “this calculation takes 15 minutes once you’ve decided which version of each line item to use.” :)
Using Huber’s numbers:
Tangible IC_2006 = $76B
Tangible IC_2016 = $111B
Step 3: Compute ROIIC
ΔNet Income = $14.7B − $11.2B = $3.5B
ΔInvested Capital = $111B − $76B = $35B

ROIIC = $3.5B / $35B = 10.0%
Walmart deployed $35 billion of incremental capital over a decade and got back $3.5 billion in incremental annual earnings. That is the marginal return on everything built between 2006 and 2016. Ten cents on the dollar.
For context, Walmart’s headline ROIC in 2016 was 13.2%. The headline number is what most investor commentary was built on. The marginal number is three full percentage points lower and that is the one that actually matters for the next decade of returns.
Step 4: Compute the reinvestment rate
Method A:
Reinvestment Rate_A = $35B / $148B = 23.6%Method B:
Reinvestment Rate_B = ($90B − $49B) / $148B = $41B / $148B = 27.7%Pretty close to each other. Method B is a touch higher, which means retention slightly outpaced deployment, which means some of the retained capital went into buybacks rather than productive capital. For Walmart that checks out. The company was buying back shares throughout this period. Not a red flag, just a description of what they were doing.
Step 5: Compute the compounding rate
IV Growth ≈ ROIIC × Reinvestment Rate
          ≈ 10% × 24%
          ≈ 2.4% per year
The investor who bought Walmart in 2006 should have expected about 2.4% annual intrinsic value growth just from the reinvestment math. Add the dividend yield (call it 2-3%) and some multiple expansion and you’re looking at total returns in the 5-8% range. Which is roughly what Walmart did from 2006 to 2016. The math worked.
Step 6: What the numbers actually say
Walmart in 2016 looked like a quality compounder. Headline ROIC 13.2%, the largest retailer in the world, steady dividend, defensive earnings. Every generic value investing commentary could include Walmart and nobody would blink.
The ROIIC decomposition tells a different story.
Marginal capital earning 10%, reinvestment at 24%, intrinsic value compounding at 2.4%. A legacy moat in late stage. The business was still high quality, but the per-dollar returns on new investment were already fading, and the total returns story depended almost entirely on dividends and buybacks, not on the underlying business growing.
Headline ROIC said great business. ROIIC said great business that had run out of places to put capital. Both statements were true. The second one was the one that mattered for buying in 2016.
What Mauboussin would do differently
Same company, same 10-K, same period. Mauboussin’s framework changes the numbers in three places.
Operating leases. Pre-2019 Walmart had a massive off-balance-sheet operating lease book. Store leases, equipment, vehicle fleet. ASC 842 hadn’t arrived yet. Rough-cut capitalization at 6-8x annual rent expense would add somewhere around $20-30 billion to the 2006 invested capital base and $25-35 billion to the 2016 base. Both endpoints get bigger. The differential also gets bigger. Net effect: ROIIC comes down another 1-2 percentage points.
NOPAT instead of net income. Walmart is not SBC-heavy and its tax rate is stable, so the swap from NI to NOPAT is cleaner than it would be for a tech company. The EBITA add-back for amortization of intangibles is small because Walmart’s intangibles are mostly goodwill from acquisitions, which doesn’t amortize. The cash tax adjustment matters a bit. Probably moves the numerator by a low single-digit percentage.
Both-sides reconciliation of invested capital. Walmart has minority interest from its international joint ventures, which appears on the liability side but not the asset side by default. The reconciliation forces you to decide how to treat it. Mauboussin’s convention is to include it. Adds a few billion to the denominator.
Net effect on Walmart 2006-2016: Mauboussin-adjusted ROIIC probably lands somewhere around 7-8%. Huber’s number is 10%. Both point in the same direction and both tell you Walmart in 2016 was a mediocre business for incremental capital deployment.
That directional agreement is the signal. When Huber and Mauboussin agree on a name, the simpler number is reliable. When they disagree materially, you have real work to do figuring out which distortion is responsible. For Walmart they agree. I trust the Huber number. For a debt-funded roll-up like TransDigm or a SBC-heavy hyperscaler like Nvidia, I would run both and dig into any gap.
Adjustments worth knowing about
Each of these can move ROIIC by several percentage points when they apply. Links go to the primary sources.
Excess cash. Strip it. Cash above about 2% of revenue for a mature business and 5% for growth is excess. Apple historically had hundreds of billions parked on the balance sheet and its ROIC looked mediocre until you stripped the excess cash, at which point the underlying business turned into one of the highest-ROIC operations in history. Direction: strip excess cash → IC goes down → ROIC and ROIIC go up.
Goodwill, in or out. Compute both. Including goodwill answers “did past M&A create value at the prices paid.” Excluding goodwill answers “what does the underlying organic operation earn on tangible capital.” Different questions, different decisions. For evaluating future M&A specifically, ROIC is the wrong tool entirely; Mauboussin says use NPV instead.
R&D capitalization. For software, pharma, semis, anywhere R&D is above ~5% of revenue, expensing R&D as it happens understates both the capital base and the NOPAT. The fix: capitalize cumulative R&D as an intangible asset, amortize over an industry-appropriate life (3-5 years for software, 10-15 for pharma), and replace the current period’s R&D expense in NOPAT with amortization of the accumulated balance. Mauboussin’s worked example: Microsoft FY2013 R&D was $10.4B vs $4.3B in capex. R&D was 2.4x the size of capex. Without capitalization, both NOPAT and invested capital are badly understated.
Owners’ earnings as the input filter. For tech and other SBC-heavy businesses, GAAP net income overstates real economic earnings because stock-based compensation gets added back as a non-cash expense. The cash spent on buybacks to mop up the resulting dilution is real money. Burry and Clifton have the cleanest treatment if you want the full version. For Nvidia, Meta, Palantir the right earnings input for ROIIC is owners’ earnings. For non-SBC-heavy businesses the adjustment doesn’t matter.
Hidden reinvestment in the income statement. Marketing spend at consumer brands. Customer acquisition cost at subscription businesses. R&D as already covered. These run through opex but function economically as growth investments. Separating maintenance from growth spend is harder than it sounds. The realistic move is to flag where it’s happening and note that the reported capex line is undercounting true reinvestment. A consumer brand spending 10% of revenue on marketing is reinvesting heavily even if its capex says otherwise.
Wrap-up
ROIIC is a quality screen and a trajectory tool. It tells you whether a business is good and whether the “good” is getting better or worse. It does not tell you whether the price is fair. That is what DCF is for. The two work together. I now use quality filter first, valuation second.
The reason to have both Huber and Mauboussin in the toolbox is that the gap between them is itself a signal. They agree on clean operating businesses with stable tax rates and modest intangibles. They disagree on leveraged roll-ups, SBC-heavy tech, and heavy-lease retailers. Each disagreement points you at the specific thing that distorts the simpler number. That is more useful than picking one methodology and pretending you know the answer.
ROIIC is also historical. Past ROIIC does not guarantee future ROIIC. Chipotle’s 35% ROIIC from 2006 to 2015 compressed sharply after 2015 as the unit growth runway saturated. The math gives you the baseline. The qualitative judgment about whether the moat persists and the runway stays open is still on you. The math just makes the qualitative question worth asking.
What I take away from spending the last few months on this: the catchy story is almost never the answer. My investments into NKE, LULU, ONON - are the prime example. The mechanical question of whether the next dollar of capital is going to earn a real return is almost always the right question. ROIIC is the first tool I reach for now. Everything else comes after.
Trust your chuyka. Don’t let FOMO eat you alive.
Not an investment advice. Think for yourself. Don’t trust online experts.